Durham Academy is measuring its carbon footprint with the help of Green Places, a Raleigh-based carbon monitoring company. This partnership is supported by the SustainABLE DA Innovation Grant that began July 1. The commitment by the Administrative Team inspired us, the students working on sustainability.
We knew we needed all hands on deck to get a complete measurement of our carbon footprint. “Complete” in this case means including scopes 1, 2, and 3. Scopes 1 and 2 include combustion sources DA owns directly, like HVAC systems and buses, plus electricity and natural gas. Scope 3 includes everything else: business travel, products we purchased, solid waste, and about a dozen other categories contained in the massive spreadsheet that Green Places shared with us in September.
The Environmental Sustainability in Action class set a goal of completing the collection by November 1 so that we could get a r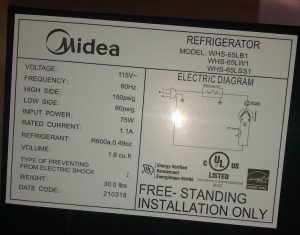 eport before the end of the semester. At first we were very daunted, but we jumped right in. Ms. Bessias handled parts of the data collection that involved outreach to many people in the staff and administration. Students handled much of the grunt work such as photographing over 100 refrigerant labels on all campuses!
Athletic transportation was a whole other challenge, and it took our class’s collective knowledge about DA athletics to figure it out. First, we met with Will Katts, one of the athletic department interns, to ask if they had one large list of all the away games. They did not. Thankfully, Will gave us an idea: calculate the average distance a DA athletics team traveled and then multiply by the number of teams.
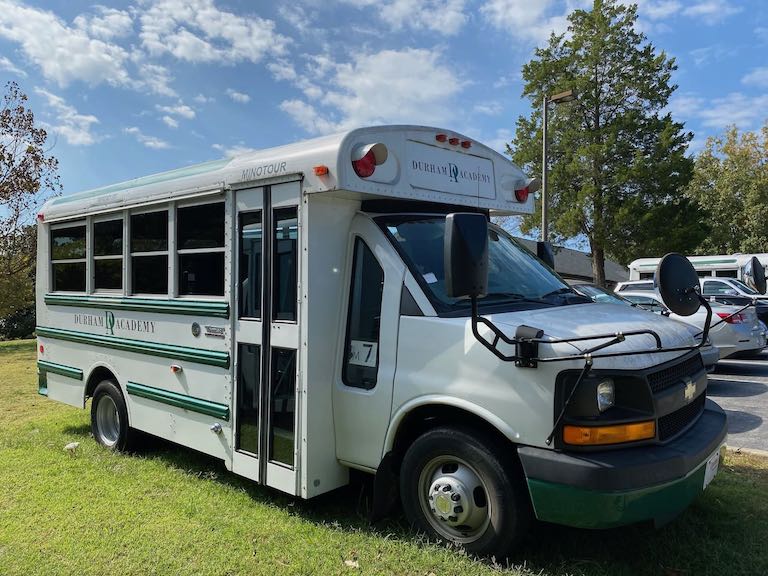
 After further thought, we refined this approach by calculating separate averages for middle school teams, junior varsity teams, and varsity teams. Then we had to account for some teams traveling on big buses and others on minibuses. We took pictures of the mechanical labels on each vehicle. After many hours of whiteboard writing, spreadsheet magic, and trips to the parking lot, we were able to make some estimates of miles traveled. We hand-calculated the mileage of about 8 different teams, and we learned that the main variable was the number of trips to Charlotte. We estimated that Varsity teams travel on average 650 miles a year, JV teams 350, and middle school teams 180. Including the daily shuttles to and from the Middle School campus, the grand total for big buses was 12,770 miles and for minibuses it was 9,320 miles during the 2020-21 year.
This whole journey of gathering data and calculating athletic transportation taught us a lot about DA and the carbon monitoring process as a whole. We realized that information might not be easy to obtain, but it can be done. You just have to ask and be willing to put in some effort to get what you need.